
Overview
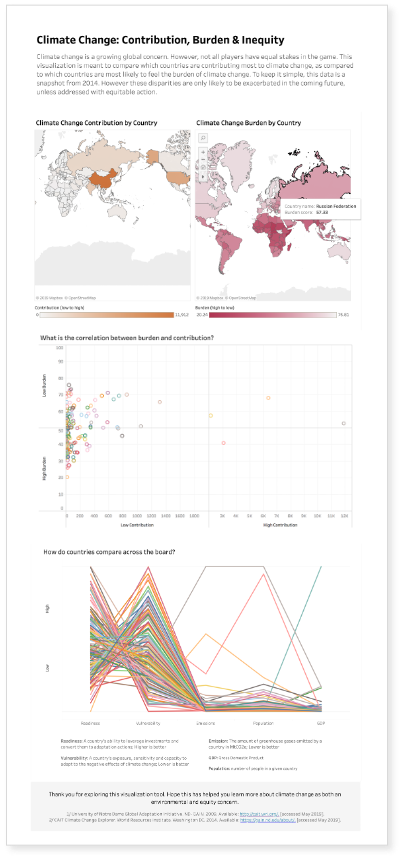
A client asked Harman design team to create a storybook of their research insights. to translate data heavy insights into fun and digestible chunks. Their main goal was to educate their peers and provide stakeholders with the critical information to enable decision making.
Challenge
How to create interesting and insightful story with dry data points.
Approach
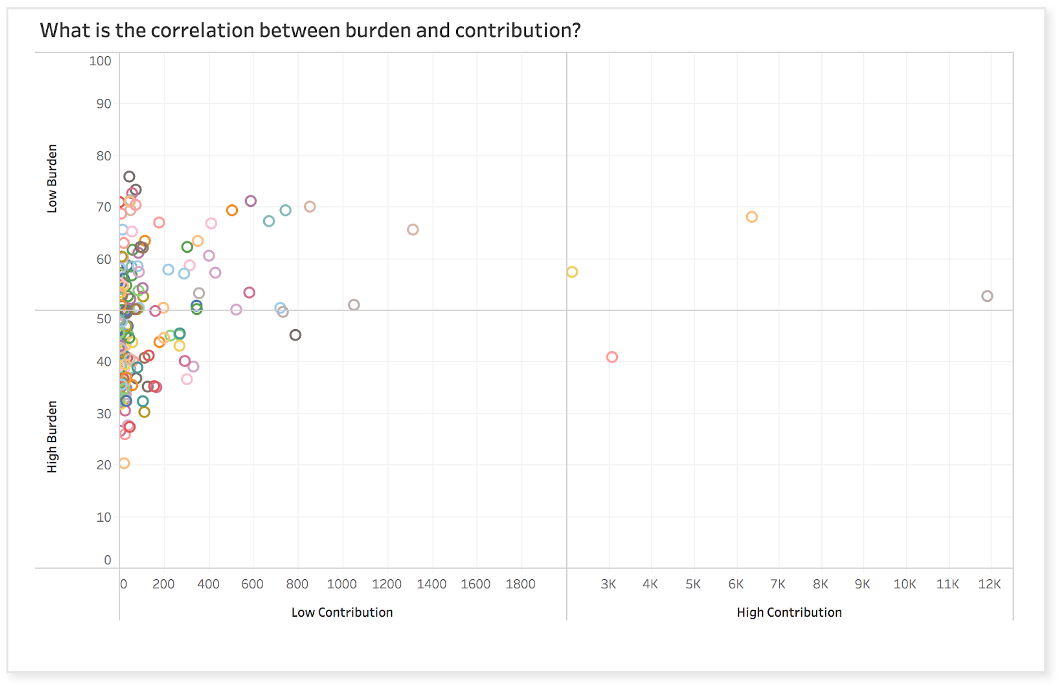
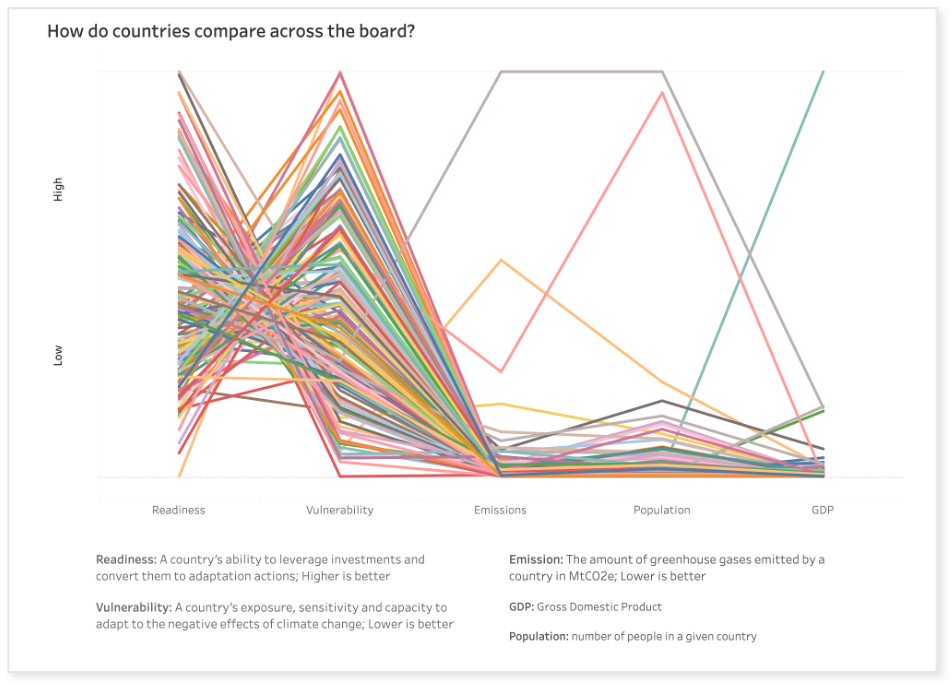
Looking at existing presentation, it was clear that content needed to be arranged in an order. Also, data visualizations had to be re-evaluated to see if that’s the best representation of the data. I started by outlining the story first, then layout and worked on data visualizations the last.
Original to wireframes
ROLE
UX, Visual and Visualization designer
TEAM
Myself

Prototype
“It’s looking excellent! Really, really loving it so thanks for all your hard work. We’re excited to share it. ”